District 1
NJ
RNicholas J. LaLota
47.0%won
average of 1 poll · result 55.2%
JP
DJohn P. Avlon
44.0%
average of 1 poll · result 44.8%
Difference: 3.0 points
Plain average R+3.0, corrected D+2.0 (±8.2) · 1 pollster, fieldwork through 2024-10-17within the margin of error
Result: Nicholas J. LaLota (R) 55.2% ✓, John P. Avlon (D) 44.8% · R+10.4. The plain poll average missed by 7.4 points toward the Democrat.
| Pollster | Fieldwork | Sample | Result | Margin | ± MOE |
|---|
| Siena College for Newsday | 2024-10-13 to 2024-10-17 | 526 LV | Nicholas J. LaLota (R) 47; John P. Avlon (D) 44 | R+3.0 | 8.2 |
District 2
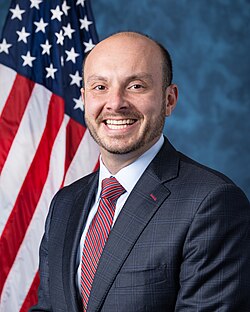
RAndrew R. Garbarino
59.7%won
result (not polled)
Difference: 19.5 points
Photos: Andrew R. Garbarino, Franmarie Metzler, House Creative Services, Public domain. Candidates without a freely licensed photo are shown by initials.
No poll ended in the final 21 days before election day.
Result: Andrew R. Garbarino (R) 59.7% ✓, Rob Lubin (D) 40.2% · R+19.5.
District 3
No poll ended in the final 21 days before election day.
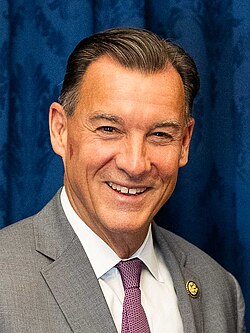
Result: Thomas R. Suozzi (D) 53.9% ✓, Mazi Melesa Pilip (R) 45.9% · D+8.0.
District 3
No poll ended in the final 21 days before election day.
Result: Thomas R. Suozzi (D) 51.7% ✓, Michael J. LiPetri Jr. (R) 48.1% · D+3.6.
District 4
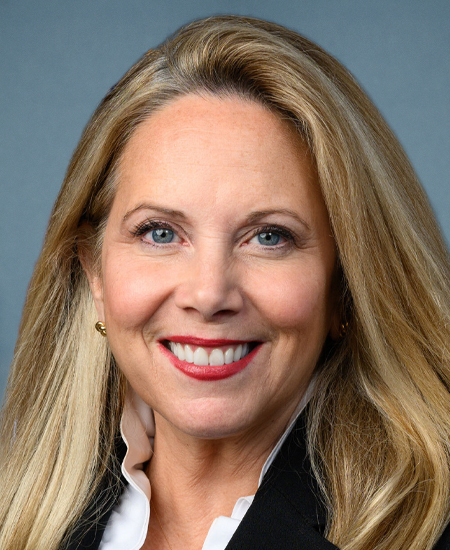
DLaura A. Gillen
49.0%won
average of 2 polls · result 51.1%
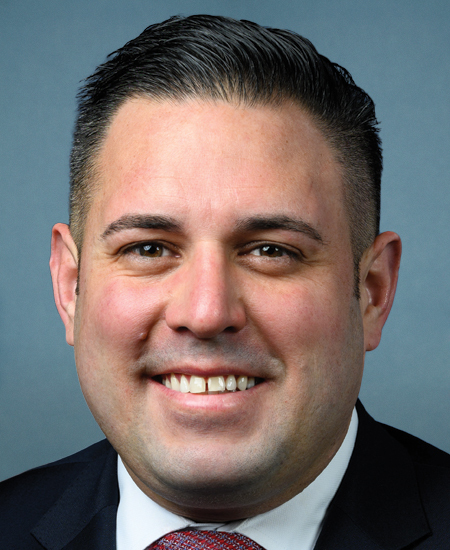
RAnthony P. D'Esposito
43.5%
average of 2 polls · result 48.8%
Difference: 5.5 points
Photos: Laura A. Gillen, US Congress official portrait, Public domain (US government work); Anthony P. D'Esposito, US Congress official portrait, Public domain (US government work). Candidates without a freely licensed photo are shown by initials.
Plain average D+5.5, corrected D+8.0 (±5.3) · 2 pollsters, fieldwork through 2024-10-19
Result: Laura A. Gillen (D) 51.1% ✓, Anthony P. D'Esposito (R) 48.8% · D+2.3. The plain poll average missed by 3.2 points toward the Democrat.
| Pollster | Fieldwork | Sample | Result | Margin | ± MOE |
|---|
| Siena College for Newsday | 2024-10-13 to 2024-10-17 | 532 LV | Laura A. Gillen (D) 53; Anthony P. D'Esposito (R) 41 | D+12.0 | 8.2 |
| Gotham Polling & Analytics | 2024-10-11 to 2024-10-19 | 734 LV | Anthony P. D'Esposito (R) 46; Laura A. Gillen (D) 45 | R+1.0 | 6.9 |
District 5
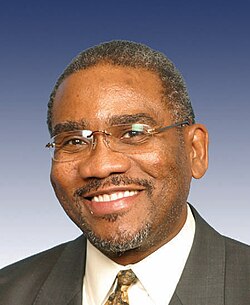
DGregory W. Meeks
72.7%won
result (not polled)
Difference: 45.7 points
Photos: Gregory W. Meeks, United States Congress, Public domain. Candidates without a freely licensed photo are shown by initials.
No poll ended in the final 21 days before election day.
Result: Gregory W. Meeks (D) 72.7% ✓, Paul King (R) 27.0% · D+45.7.
District 6
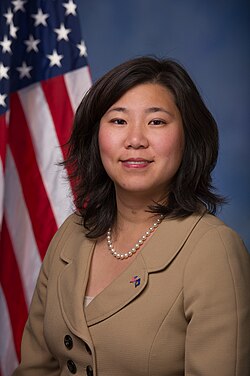
DGrace Meng
60.5%won
result (not polled)
Difference: 23.0 points Also: Joseph Chou (OTH) 1.6%
Photos: Grace Meng, U.S. House of Representatives, Public domain. Candidates without a freely licensed photo are shown by initials.
No poll ended in the final 21 days before election day.
Result: Grace Meng (D) 60.5% ✓, Thomas Zmich (R) 37.5%, Joseph Chou (OTH) 1.6% · D+23.0.
District 7
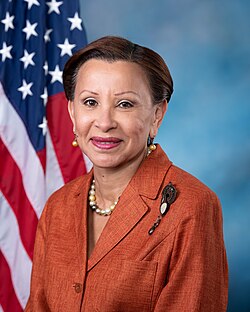
DNydia M. Velazquez
69.6%won
result (not polled)
Difference: 39.4 points
Photos: Nydia M. Velazquez, US House Office of Photography, Public domain. Candidates without a freely licensed photo are shown by initials.
No poll ended in the final 21 days before election day.
Result: Nydia M. Velazquez (D) 69.6% ✓, William Kregler (R) 30.1% · D+39.4.
District 8
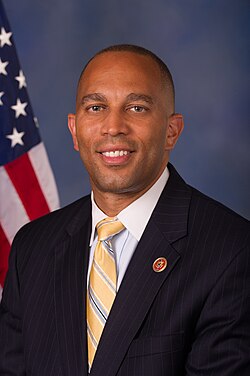
DHakeem Jeffries
75.1%won
result (not polled)
Difference: 50.6 points
Photos: Hakeem Jeffries, United States Congress, Public domain. Candidates without a freely licensed photo are shown by initials.
No poll ended in the final 21 days before election day.
Result: Hakeem Jeffries (D) 75.1% ✓, John Delaney (R) 24.5% · D+50.6.
District 9
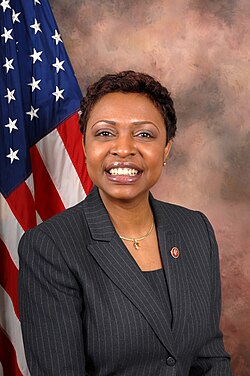
DYvette D. Clarke
73.5%won
result (not polled)
Difference: 48.0 points
Photos: Yvette D. Clarke, United States Congress., Public domain. Candidates without a freely licensed photo are shown by initials.
No poll ended in the final 21 days before election day.
Result: Yvette D. Clarke (D) 73.5% ✓, Menachem M. Raitport (R) 25.5% · D+48.0.
District 10
DG
DDaniel Goldman
81.0%won
result (not polled)
Difference: 66.3 points Also: Paul Briscoe (CRV) 2.6%
No poll ended in the final 21 days before election day.
Result: Daniel Goldman (D) 81.0% ✓, Alexander Dodenhoff (R) 14.8%, Paul Briscoe (CRV) 2.6% · D+66.3.
District 11
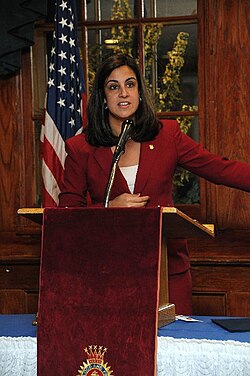
RNicole Malliotakis
63.8%won
result (not polled)
Difference: 28.1 points
Photos: Nicole Malliotakis, Paulmarronejr, CC BY-SA 3.0. Candidates without a freely licensed photo are shown by initials.
No poll ended in the final 21 days before election day.
Result: Nicole Malliotakis (R) 63.8% ✓, Andrea Morse (D) 35.8% · R+28.1.
District 12
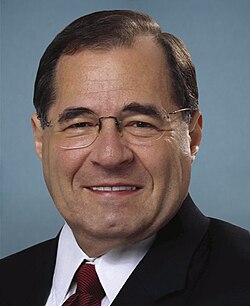
DJerry Nadler
80.3%won
result (not polled)
Difference: 60.9 points
Photos: Jerry Nadler, US House of Representatives, Public domain. Candidates without a freely licensed photo are shown by initials.
No poll ended in the final 21 days before election day.
Result: Jerry Nadler (D) 80.3% ✓, Mike Zumbluskas (R) 19.4% · D+60.9.
District 13
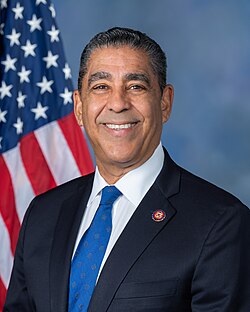
DAdriano Espaillat
83.0%won
result (not polled)
Difference: 66.7 points
Photos: Adriano Espaillat, US House of Representatives, Public domain. Candidates without a freely licensed photo are shown by initials.
No poll ended in the final 21 days before election day.
Result: Adriano Espaillat (D) 83.0% ✓, Ruben D. Vargas (R) 16.4% · D+66.7.
District 14
No poll ended in the final 21 days before election day.
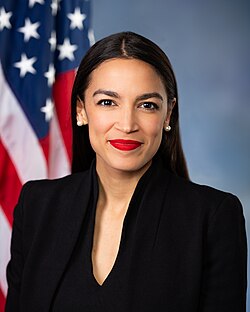
Result: Alexandria Ocasio-Cortez (D) 68.9% ✓, Tina Forte (R) 30.7% · D+38.2.
District 15
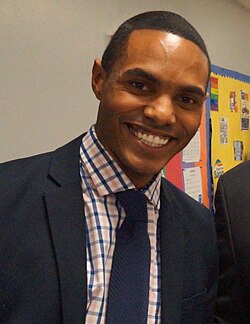
DRitchie Torres
76.2%won
result (not polled)
Difference: 55.2 points Also: Jose David Vega (OTH) 2.4%
Photos: Ritchie Torres, SAGE from New York City, USA, CC BY 2.0. Candidates without a freely licensed photo are shown by initials.
No poll ended in the final 21 days before election day.
Result: Ritchie Torres (D) 76.2% ✓, Gonzalo Duran (R) 21.1%, Jose David Vega (OTH) 2.4% · D+55.2.
District 16
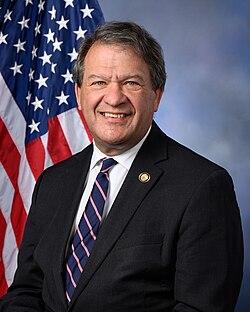
DGeorge S. Latimer
71.3%won
result (not polled)
Difference: 43.0 points
Photos: George S. Latimer, Nate Payne, House Creative Services, Public domain. Candidates without a freely licensed photo are shown by initials.
No poll ended in the final 21 days before election day.
Result: George S. Latimer (D) 71.3% ✓, Miriam Levitt Flisser (R) 28.3% · D+43.0.
District 17
Plain average R+4.6, corrected R+7.3 (±8.6) · 1 pollster, fieldwork through 2024-10-26within the margin of error
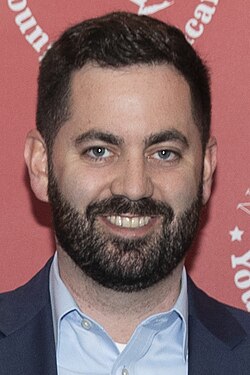
Result: Mike Lawler (R) 52.1% ✓, Mondaire L. Jones (D) 45.8%, Anthony Frascone (WFP) 2.0% · R+6.3. The plain poll average missed by 1.7 points toward the Democrat.
| Pollster | Fieldwork | Sample | Result | Margin | ± MOE |
|---|
| Emerson College for The Hill | PIX 11 | 2024-10-24 to 2024-10-26 | 475 LV | Mike Lawler (R) 48.6; Mondaire L. Jones (D) 44; Anthony Frascone (OTH) 0.8 | R+4.6 | 8.6 |
District 18
PR
DPat Ryan
51.3%won
average of 1 poll · result 57.1%
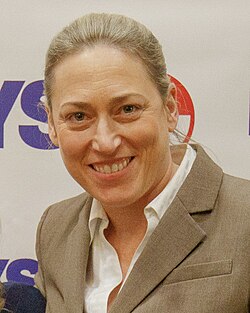
RAlison Esposito
41.6%
average of 1 poll · result 42.8%
Difference: 9.7 points
Photos: Alison Esposito, New York State Young Republicans, CC BY 2.0. Candidates without a freely licensed photo are shown by initials.
Plain average D+9.7, corrected D+7.0 (±8.9) · 1 pollster, fieldwork through 2024-10-26within the margin of error
Result: Pat Ryan (D) 57.1% ✓, Alison Esposito (R) 42.8% · D+14.3. The plain poll average missed by 4.6 points toward the Republican.
| Pollster | Fieldwork | Sample | Result | Margin | ± MOE |
|---|
| Emerson College for The Hill | PIX 11 | 2024-10-24 to 2024-10-26 | 450 LV | Pat Ryan (D) 51.3; Alison Esposito (R) 41.6 | D+9.7 | 8.9 |
District 19
Plain average D+4.0, corrected D+4.8 (±7.8) · 1 pollster, fieldwork through 2024-10-16within the margin of error
Result: Josh Riley (D) 51.0% ✓, Marcus Molinaro (R) 48.8% · D+2.2. The plain poll average missed by 1.8 points toward the Democrat.
| Pollster | Fieldwork | Sample | Result | Margin | ± MOE |
|---|
| SurveyUSA for WNYT-TV | 2024-10-11 to 2024-10-16 | 561 LV | Josh Riley (D) 46; Marcus Molinaro (R) 42 | D+4.0 | 7.8 |
District 20
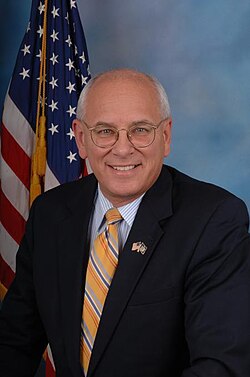
DPaul D. Tonko
60.1%won
result (not polled)
Difference: 20.3 points
Photos: Paul D. Tonko, U.S. Congress, Public domain. Candidates without a freely licensed photo are shown by initials.
No poll ended in the final 21 days before election day.
Result: Paul D. Tonko (D) 60.1% ✓, Kevin M. Waltz (R) 39.8% · D+20.3.
District 21
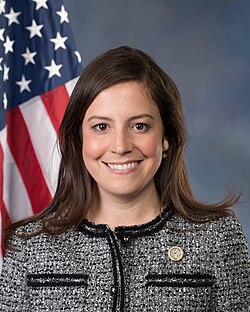
RElise M. Stefanik
62.0%won
result (not polled)
Difference: 24.0 points
Photos: Elise M. Stefanik, United States House of Representatives, Public domain. Candidates without a freely licensed photo are shown by initials.
No poll ended in the final 21 days before election day.
Result: Elise M. Stefanik (R) 62.0% ✓, Paula Collins (D) 38.0% · R+24.0.
District 22
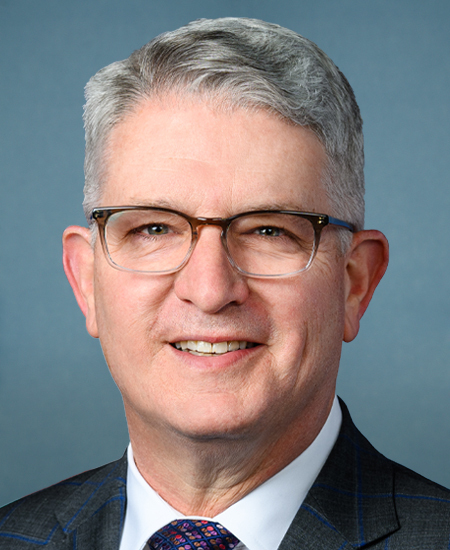
RBrandon M. Williams
46.0%
average of 1 poll · result 45.4%
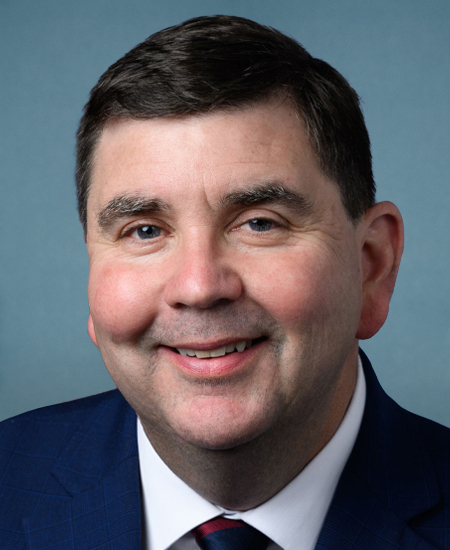
DJohn W. Mannion
46.0%won
average of 1 poll · result 54.5%
Difference: 0.0 points
Photos: Brandon M. Williams, US Congress official portrait, Public domain (US government work); John W. Mannion, US Congress official portrait, Public domain (US government work). Candidates without a freely licensed photo are shown by initials.
Plain average Tied, corrected D+3.2 (±9.4) · 1 pollster, fieldwork through 2024-10-17within the margin of error
Result: John W. Mannion (D) 54.5% ✓, Brandon M. Williams (R) 45.4% · D+9.1. The plain poll average missed by 9.1 points toward the Republican.
| Pollster | Fieldwork | Sample | Result | Margin | ± MOE |
|---|
| McLaughlin & Associates(REP-aligned) | 2024-10-15 to 2024-10-17 | 400 LV | John W. Mannion (D) 46; Brandon M. Williams (R) 46 | Tied | 9.4 |
District 23
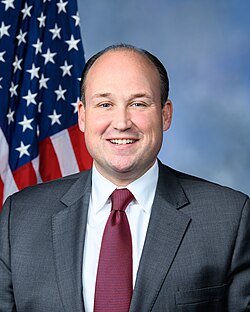
RNicholas A. Langworthy
65.8%won
result (not polled)
Difference: 31.6 points
Photos: Nicholas A. Langworthy, Langworthy.House.Gov, Public domain. Candidates without a freely licensed photo are shown by initials.
No poll ended in the final 21 days before election day.
Result: Nicholas A. Langworthy (R) 65.8% ✓, Thomas A. Carle (D) 34.2% · R+31.6.
District 24
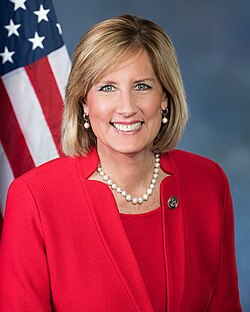
RClaudia Tenney
65.6%won
result (not polled)
Difference: 31.3 points
Photos: Claudia Tenney, United States Congress, Public domain. Candidates without a freely licensed photo are shown by initials.
No poll ended in the final 21 days before election day.
Result: Claudia Tenney (R) 65.6% ✓, David Wagenhauser (D) 34.3% · R+31.3.
District 25
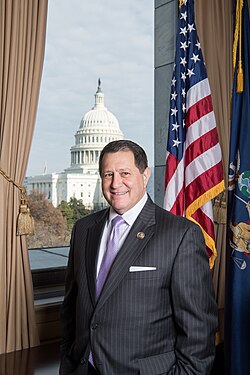
DJoseph D. Morelle
60.8%won
result (not polled)
Difference: 21.6 points
Photos: Joseph D. Morelle, United States Congress, Public domain. Candidates without a freely licensed photo are shown by initials.
No poll ended in the final 21 days before election day.
Result: Joseph D. Morelle (D) 60.8% ✓, Gregg A. Sadwick (R) 39.1% · D+21.6.
District 26
No poll ended in the final 21 days before election day.
Result: Timothy M. Kennedy (D) 68.5% ✓, Gary Dickson (R) 31.3% · D+37.1.
District 26
No poll ended in the final 21 days before election day.
Result: Timothy M. Kennedy (D) 65.1% ✓, Anthony G. Marecki (R) 34.8% · D+30.3.